
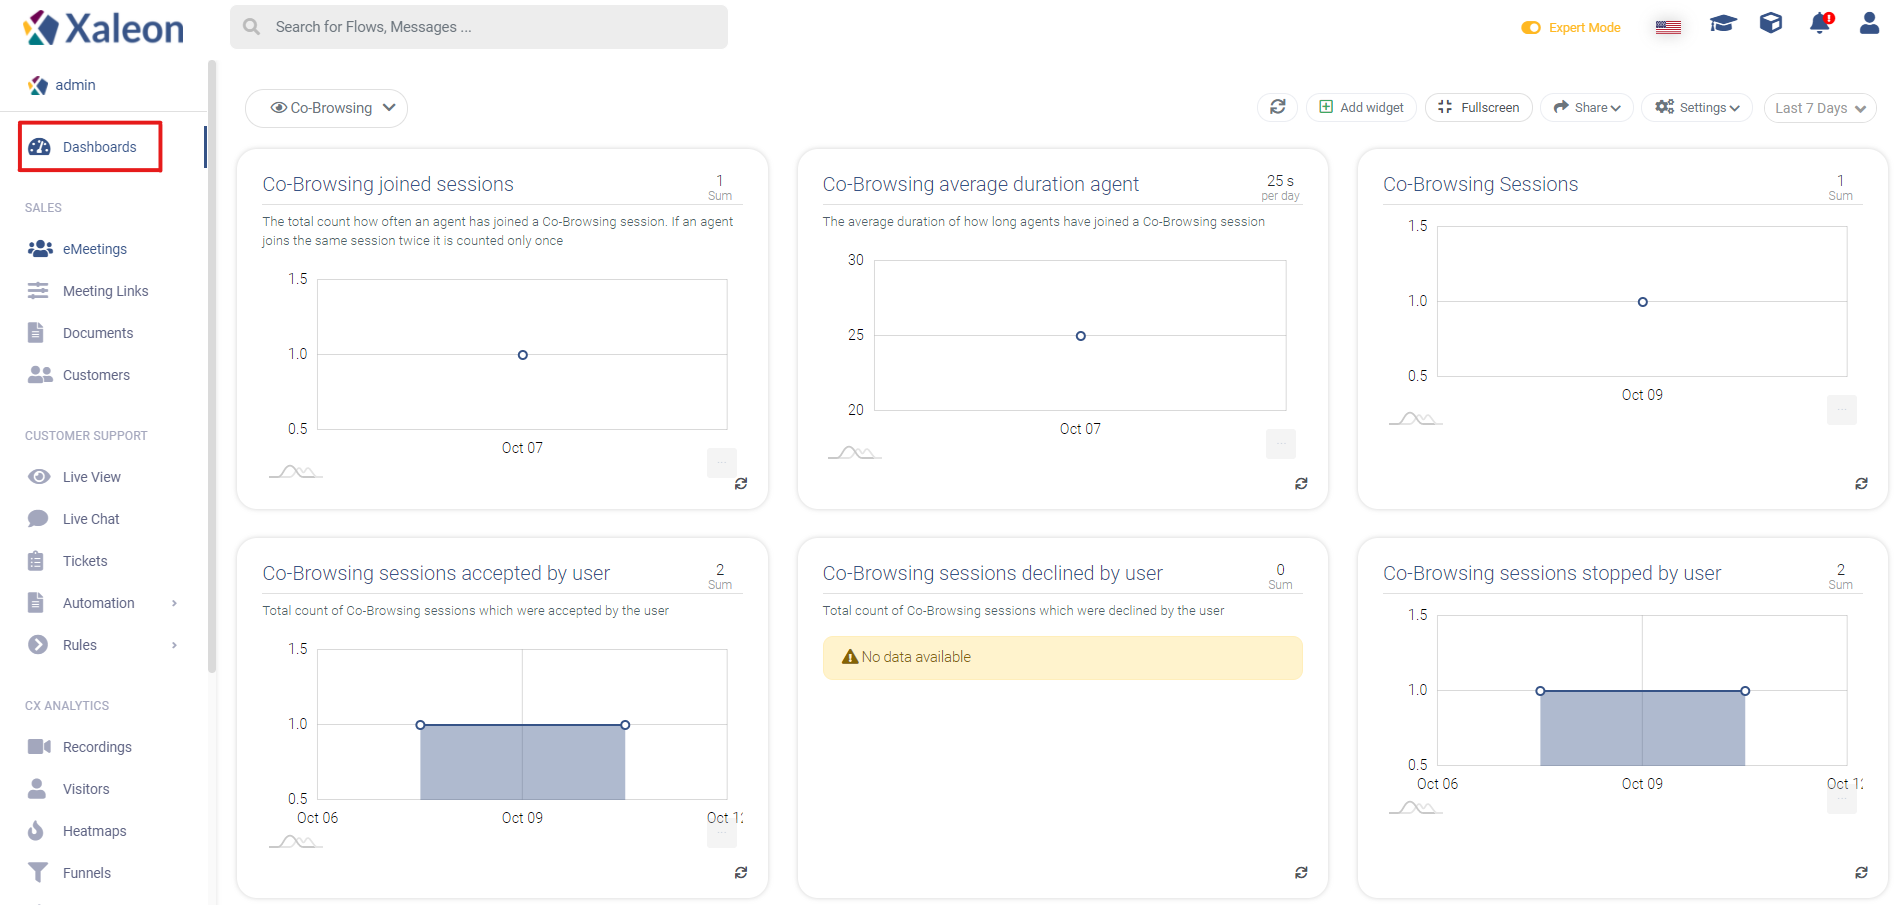
Dashboard
TeamViewer Engage provides you with various statistics which are rehashed in different dashboard views. You find the Dashboard in the main menu on the left.
Customize your Dashboard
Create a new Dashboard

You can customize current Dashboards just as you like. If needed, you can simply add a new Dashboard to fit all your requirements by clicking on + New Dashboard.
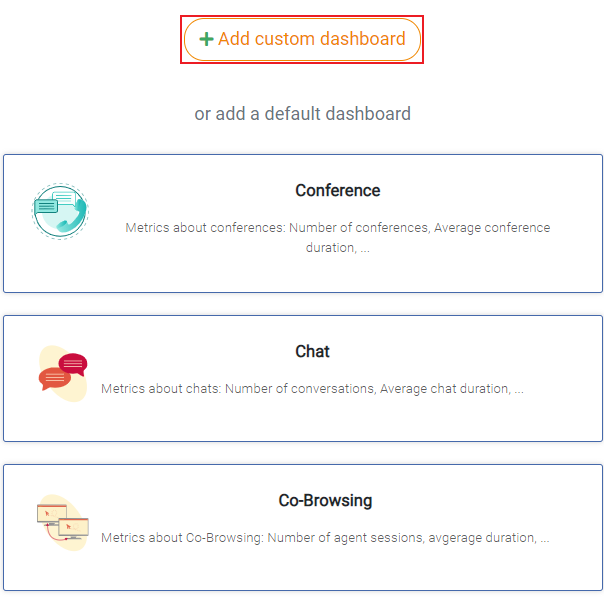
Afterwards you can choose to create a custom dashboard or add a default one. To add a custom dashboard simply click + Add custom dashboard

Before the dashboard can be created, it has to be given a name. Optionally you can add an icon to identify the dashboard faster afterwards.

After the dashboard has been created, it can be set as default by clicking the Set as default button. Furthermore, you can add widgets to view statistics of your TeamViewer Engage Console. To add widgets press the Add widget button.
Add new Widgets

When clicking on the Add widget button, the Widget Configuration window shows up where you can configure your new widget. You can choose from different categories to select your statistic data. Depending on your selection, you can choose from various Data Sources.

Then you have to select the type of representation.

At last you can configure the title, color and the description (optional).
Edit Mode

The currently selected dashboard can be editted by clicking on Settings and then Edit. You can also delete the dashboard by clicking on Delete Dashboard.

While the edit mode is active, you can drag and drop the widgets as you like. Additionally, you can filter, group edit and delete the current widgets. The edit mode can be closed by clicking on the Close edit mode button in the top right corner
Realtime
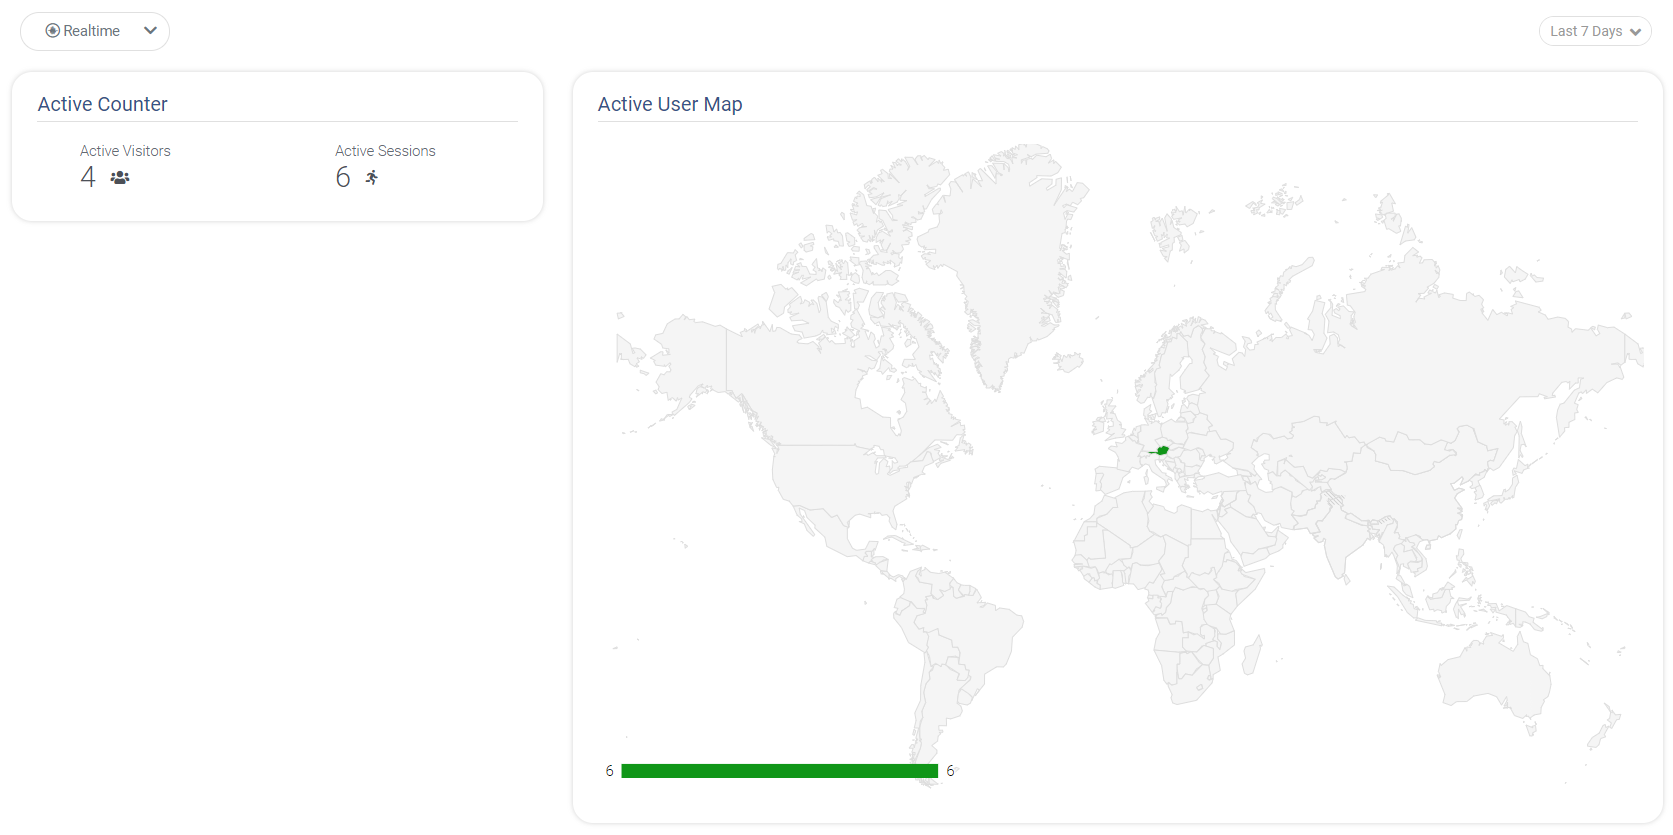
In Realtime you see all sessions that are currently active on your website. The map shows where the visitors are coming from. Further below you see the actual list of sessions, which you can join by clicking on them.
To enable this dashboard, make sure that you created the
Co-Browsing / Analyticsplugin and integrated it to your website.
Chat
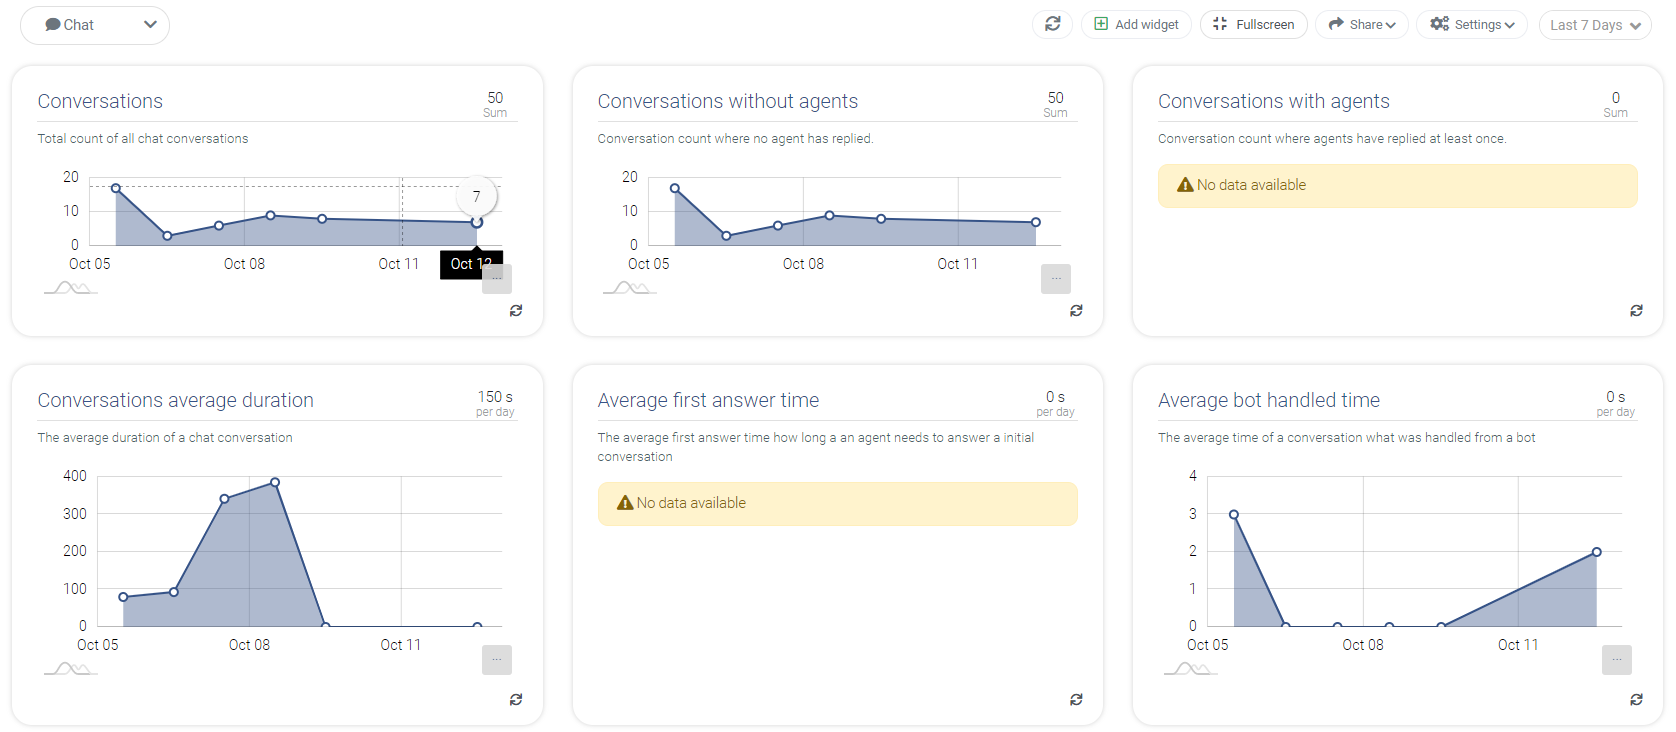
All incoming conversations and messages from WebChat or Facebook Messenger are evaluated. In Chat you can find helpful metrics regarding that. You can change the time scope by clicking on the default Last 7 Days button in the top right corner.
Number of Conversations
Generally, a Conversation is opened every time a customer messages you through WebChat or Facebook Messenger. Conversations are re-opened/counted again,
- in WebChat, when the user closes the browser (window.sessionStorage is cleared) and visits the page again;
- in Facebook Messenger, when the user sends a message after a 15 minute pause.
Conversation Duration
When a Conversation is opened, it is marked as UNRESOLVED. The Conversations average duration is the time the Conversation is marked as such. This happens to be until an agent changes the state to DONE.
Average Response Time
Time range between marking the user as UNRESOLVED and the first message sent by a support agent. The average response time can be found under the Conversations average duration.
Visitors
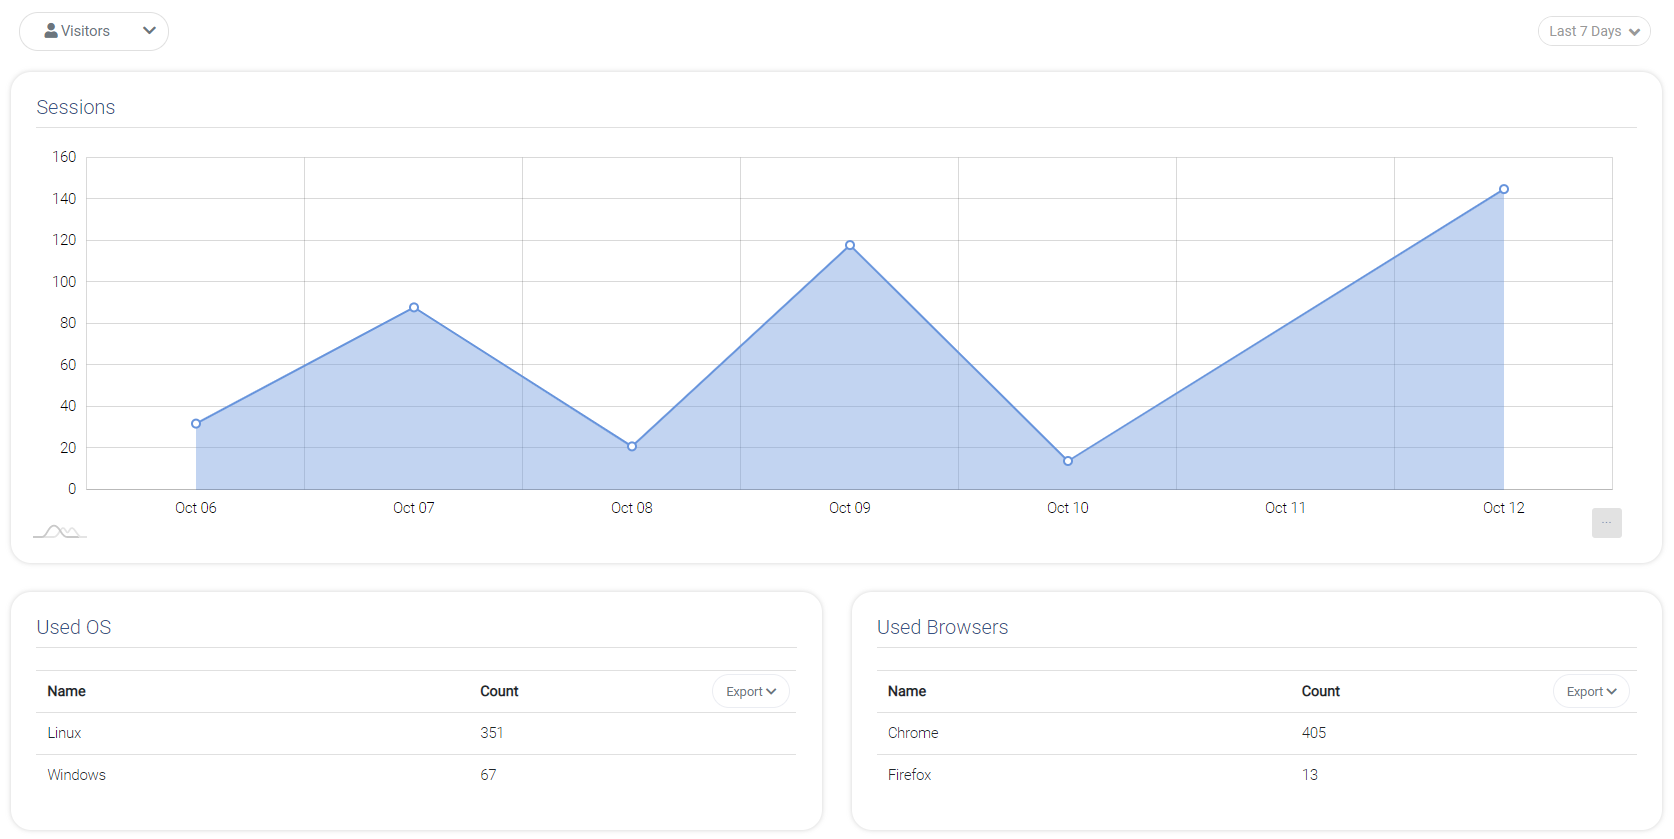
Get an overview how many sessions where opened on your website in the day-by-day in the past. Learn which browsers and devices visitors most likely use. Furthermore, you can view the most used devices as well as the top countries.
Agents
Learn more about the activity of each of your agents and the who the people are that reach out to you.
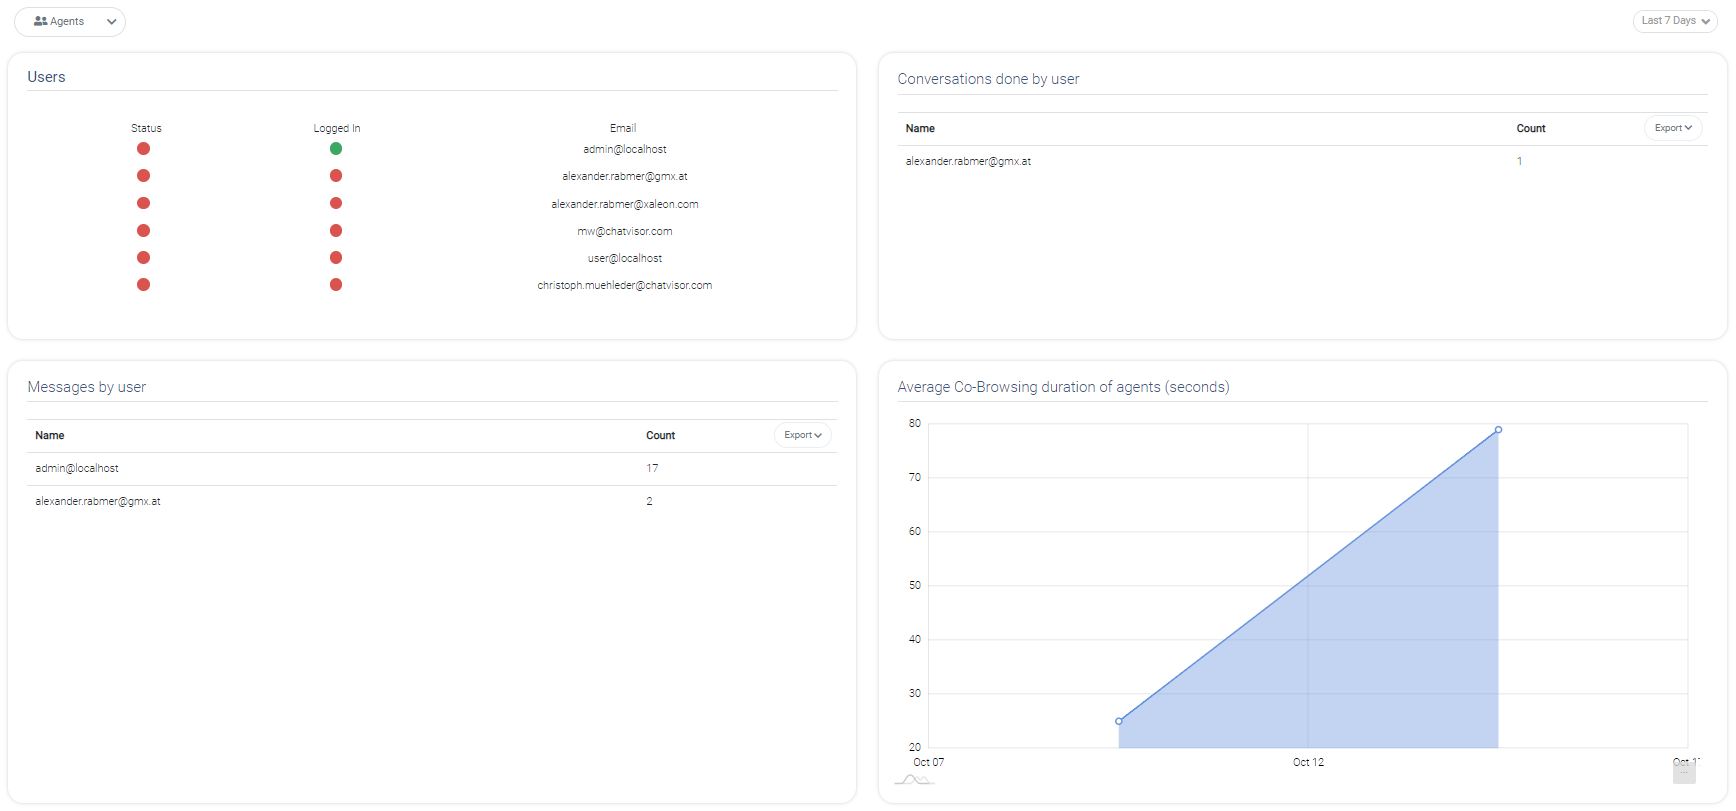
Users
List of registered users, including information:
- Status - is user currently an available agent (is his status online/offline).
- Logged In - is user currently logged into platform (no matter if he set himself available or not).
Conversations done by user
Number of conversations handled by each user within set time period.
Messages by user
Number of messages sent (outgoing) by each user within set time period.
Average CoBrowsing duration
Number of minutes CoBrowsing sessions took from start to end per average.
Agent online status
Timeline to show how available agents were over course of time.